
Van and Fleet Running Cost Spreadsheet
This van and fleet running cost spreadsheet works out what each vehicle really costs a mile — the value it lost and the days it spent off the road included — and tells you the month a van stops being worth keeping.
Every fleet template on the internet is a maintenance log: it records what happened and stops there. Two of the largest costs of running a van never appear on a bank statement, so they never appear in a spreadsheet either — the value it lost this year, and the working days it spent on a lift while you could not send it out. Leave those two out and the van with no monthly payment looks like the cheap one.
What is in it
- Eight tabs, 1,031 formulas and two charts. Setup takes six numbers: what you charge an hour, chargeable hours in your day, working days in the year, the fuel price, and what a rental van costs you.
- Vans — one row per vehicle: what you paid, what you still owe, the odometer at the start of the year and today, insurance, plates, depreciation and resale value.
- Fuel — every fill-up. The sheet works out the miles between fills and the real miles per gallon that tank did, and flags an odometer typed in backwards.
- Shop Bills — every service, tyre and repair, with the column that changes the answer: days off the road. Each bill gets a second figure beside it, the work you could not do while the van was in.
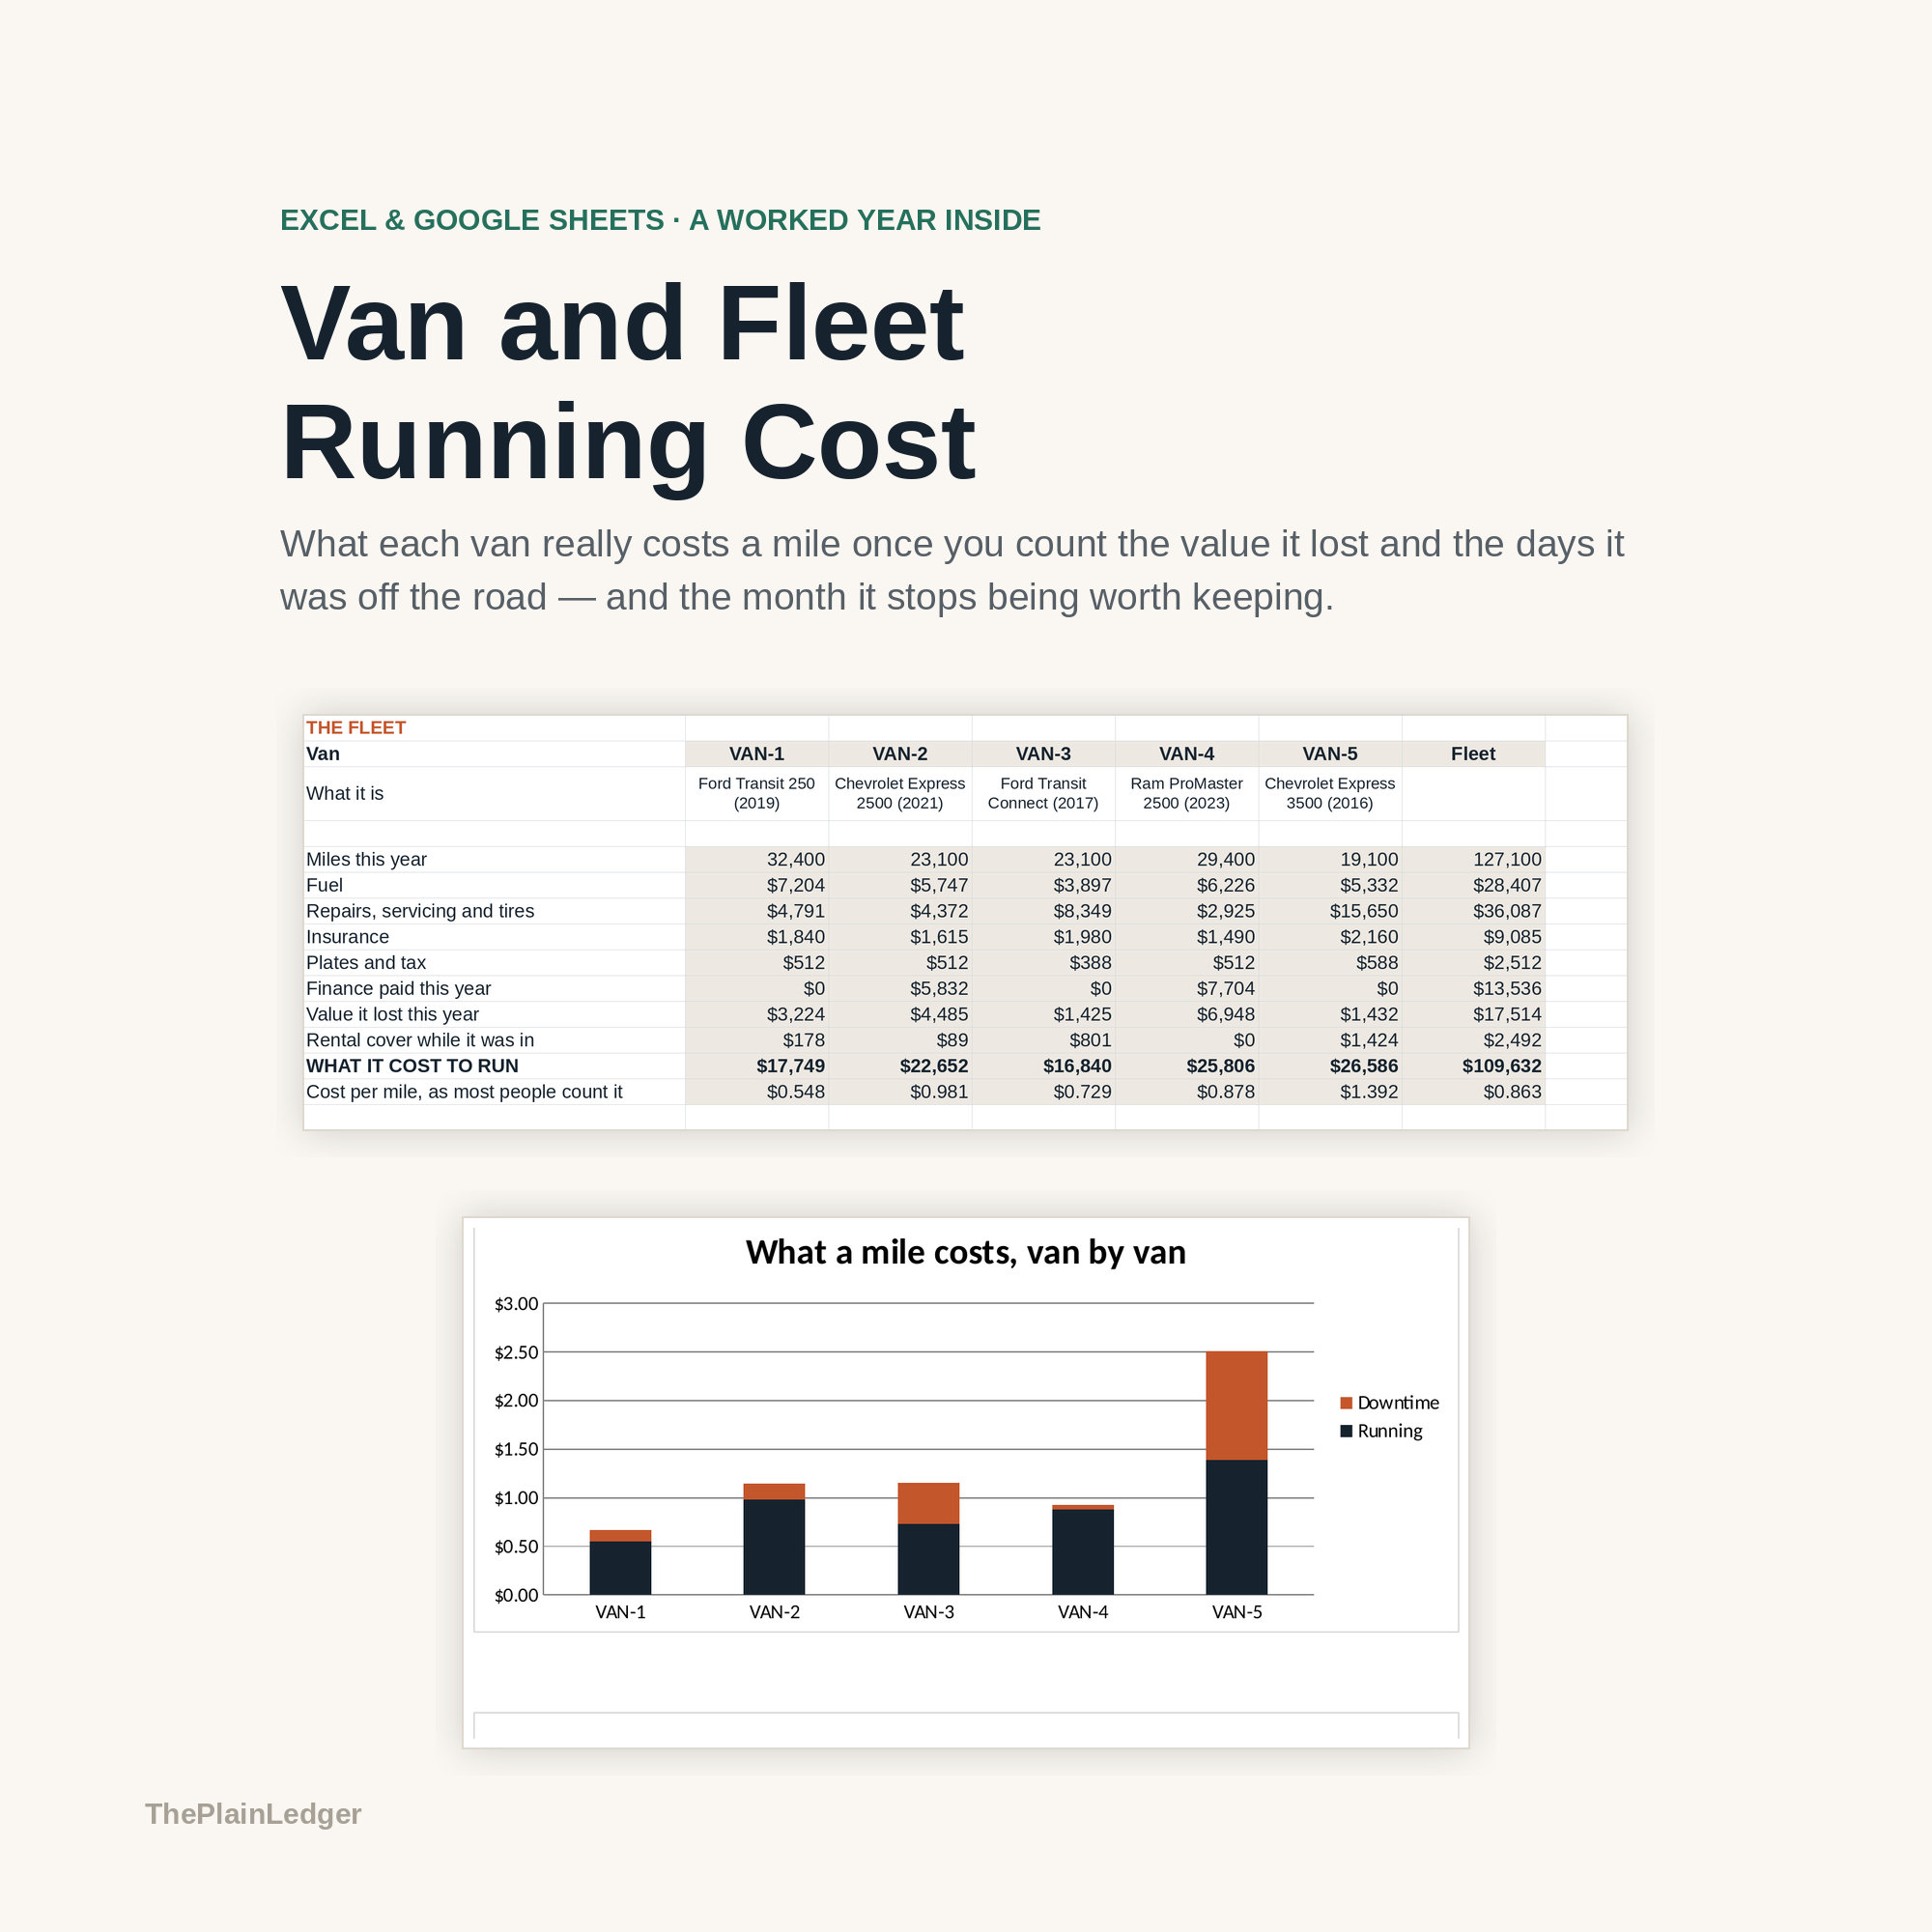
- Cost Per Mile — fuel, repairs, insurance, plates, finance, value lost, rental cover and downtime, divided by the miles. Keep or Replace sets each van against a replacement you have actually been quoted for, with what the old one is worth, how long the switch takes to pay for itself, and a one-word verdict.
- Dashboard — four numbers, two charts and one sentence: fleet cost per mile, what the fleet cost you this year, days off the road, and the work those days cost.
Who it is for
Plumbers, electricians, HVAC firms, landscapers, builders, mobile mechanics and couriers running two to ten vans who have never actually costed them. It costs a vehicle rather than a job, so it will not tell you which customer is unprofitable.
The worked example
The example inside is a five-van plumbing and heating company across twelve months, with 260 fill-ups and 56 shop bills written up. The 2016 van is paid off and loses the least value of the five, and it costs $2.51 a mile. The 2023 van, still on $642 a month, costs $0.93.
The difference is the repairs and the Tuesdays. That old van spent 28 working days on a lift, which is $15,650 of repair bills and $21,280 of work that never happened while it was in — the second figure being the larger one, and the one no bank statement shows. Set against a replacement the company has actually been quoted for, swapping it saves $24,883 a year and the switch pays for itself in eighteen months.
How it works
Compatible with Microsoft Excel 2016 or newer on Windows or Mac, Google Sheets, and LibreOffice. No macros, no add-ons, no account to create, nothing to install.
The download has two workbooks: one with the example above already filled in, so you can see what every column expects, and the same file completely blank for your own figures. A plain-English guide comes as a PDF. Order on WhatsApp — $9
Orders are taken on WhatsApp: message me and I’ll send the payment details, then the files as soon as the payment is confirmed.
A look inside the file
Questions people actually ask
How do I work out what a van actually costs me per mile?
You enter the van, its fill-ups and its repair bills, and the Cost Per Mile tab stacks up fuel, repairs, insurance, plates, finance, the value the van lost, any rental cover and the downtime, then divides by the miles between the two odometer readings. The answer is a single dollars-per-mile figure for each vehicle. In the worked example one van comes out at $2.51 a mile and another at $0.93.
How many vans is this built for?
Two to ten vans, which is the range most trade firms sit in; the worked example runs five. It suits plumbers, electricians, HVAC firms, landscapers, builders, mobile mechanics and couriers. It costs a vehicle rather than a job, so it will not tell you which customer is unprofitable.
I don't know what my vans are worth or how much they lost this year.
Depreciation in this file is an estimate, and it is meant to be — you put in what you paid and what you could sell it for today. Because the same logic is applied to the replacement van on the Keep or Replace tab, the comparison between keeping and swapping still holds even if your resale figure is a little out.
Will it work in Google Sheets or do I need Excel?
Yes — it is built as .xlsx and imports into Google Sheets through File, then Import, then Upload; the 1,031 formulas and both charts carry over. It also opens in Excel 2016 or newer on Windows and Mac, and in LibreOffice. There are no macros and no add-ons to enable.
Does it read my telematics or my fuel card?
No — it does not connect to telematics, a fuel card or your accounting software, and it never asks to. You type the fill-ups and the bills in. One column matters more than the rest: if you leave days off the road blank, the file is only a maintenance log.
Need it built around your business?
This file assumes two to ten vans, one hourly charge-out rate, and depreciation estimated the same way for the old van and its replacement. If you run mixed vehicle types, subcontract drivers, charge by the job rather than the hour, or carry vehicles on contract hire, I can rebuild the same cost-per-mile arithmetic around your fleet.
All other templates are listed on the Excel & Google Sheets Templates page.