
Rideshare & Delivery Driver Income Tracker
This rideshare income tracker works out what each shift actually left you after the platform’s commission and the real cost of the miles you drove.
A weekly earnings summary shows fares and fees. It never shows the cost of driving the miles that earned them, so the number you think you made and the number you keep are not the same. This file subtracts both, shift by shift, and totals six months.
What is in it
- Five tabs and 1,053 formulas: Start Here, Setup, Shifts, Expenses and Dashboard.
- Setup — three numbers: the platform’s blended commission, your real cost per mile driven, and average vehicle costs per shift. Change any of them and every shift recalculates.
- Shifts — one row per shift: date, platform, trips and miles driven typed in; platform fee, mileage cost, net payout and net shift income worked out on the row.
- Expenses — insurance, permits, phone plan, maintenance and gear, all subtracted from the net number on the Dashboard.
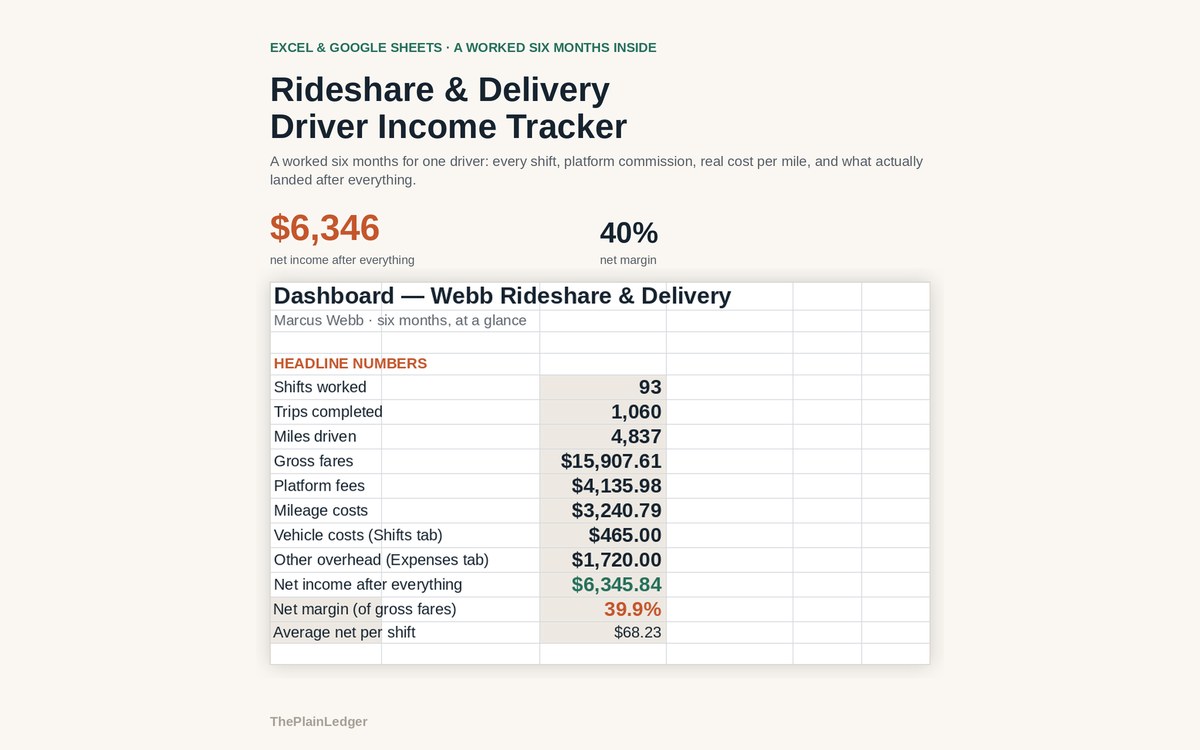
- Dashboard — shifts, trips, miles driven, gross fares, platform fees, mileage costs, other overhead, and what you actually netted.
- Shifts and net income month by month, plus every shift ranked by net income rather than by the fares collected.
Who it is for
Drivers running rideshare, delivery, or both, full time or around another job — anyone whose only record is the app’s weekly summary and who has never priced the miles behind it.
The worked example
The filled-in workbook is six months for one driver: 93 shifts across rideshare and delivery platforms. Gross fares came to $15,908, and platform fees plus mileage cost took $7,377 of that over the six months. With overhead subtracted as well, $6,346 was actually kept — a 40% net margin.
The per-shift view is the point. A fare charged at $25 loses a 26% platform commission first, then the real cost of the miles it took to earn it, and what is left never appears on the app’s weekly summary. Ranked by net income rather than by fares, a month with more shifts does not always beat a quieter month with better weekend fares.
How it works
Compatible with Microsoft Excel 2016 or newer on Windows or Mac, Google Sheets, and LibreOffice. No macros, no add-ons, no account to create, nothing to install.
The download has two workbooks: one with the example above already filled in, so you can see what every column expects, and the same file completely blank for your own figures. A plain-English guide comes as a PDF. Order on WhatsApp — $9
Orders are taken on WhatsApp: message me and I’ll send the payment details, then the files as soon as the payment is confirmed.
A look inside the file
Questions people actually ask
What does a rideshare income tracker actually calculate?
It calculates net income per shift — gross fares minus the platform's commission and the real cost of the miles driven — and totals it over the period. In the worked example, 93 shifts grossing $15,908 gave up $7,377 to platform fees and mileage cost over six months, and $6,346 was actually kept, a 40% net margin.
Does it cover delivery as well as rideshare?
Yes — the worked six months mixes rideshare and delivery platforms in the same sheet. Each shift row carries the platform you worked, so you can compare them side by side by net income rather than by fares. Any platform name you type is accepted.
I do not know my real cost per mile. What do I put in?
Put in your best estimate to start; the Setup tab holds it as one editable number and the whole sheet reprices the moment you change it. It is meant to cover fuel, maintenance, tyres and depreciation, so the figure is usually well above fuel alone. Refine it once a few months of expenses are entered.
Does it run in Google Sheets?
Yes — it is built as .xlsx and imports into Google Sheets through File, Import, Upload, with the formulas carrying over. It also opens in Excel 2016 or newer on Windows and Mac, and in LibreOffice. There are no macros and nothing to install.
Does it connect to my driver app?
No — it never connects to a driver app or a bank account, and it asks for no login of any kind. You type shifts in from your own weekly summaries and the file stays on your computer. It tracks what you were paid and what the driving cost, not self-employment tax or quarterly filings.
Need it built around your business?
This file assumes a blended commission rate and a simple cost per mile. If your driving works differently — two or three apps side by side on different commissions, a leased or rented vehicle charged weekly, delivery paid per drop rather than per fare, tips tracked separately — I can rebuild the same arithmetic around how you actually earn and what the driving really costs you.
All other templates are listed on the Excel & Google Sheets Templates page.