
Real Estate Agent Commission and Listing Tracker Spreadsheet
This real estate agent commission tracker takes every closing, subtracts the brokerage split, the franchise fee, the transaction fee and the marketing you paid for, and shows the commission you actually kept.
A commission statement shows one deal at a time and stops at the cheque. It never adds six months of splits together, and it never subtracts the MLS dues, the desk fee, the photography or the mileage you paid to win those deals. This file does both, so gross production and take-home stop being the same number in your head.
What is in it
- Six tabs and 181 formulas, from Start Here through to the Dashboard.
- Setup — your name, your brokerage, your split percentage, the franchise fee and the flat transaction fee. Renegotiate your split or move brokerages and every past and future closing recalculates.
- Closings — one row per closed deal. Sale price and commission rate go in; your split, the franchise fee, the transaction fee, the marketing cost and your net commission calculate themselves.
- Pipeline — every listing and pending deal that has not closed yet: list price, list date, status and days on market, kept separate from the deals that already paid you.
- Expenses — MLS dues, E&O insurance, desk fees, photography, mileage and CRM software: everything you pay to run the business outside the split.
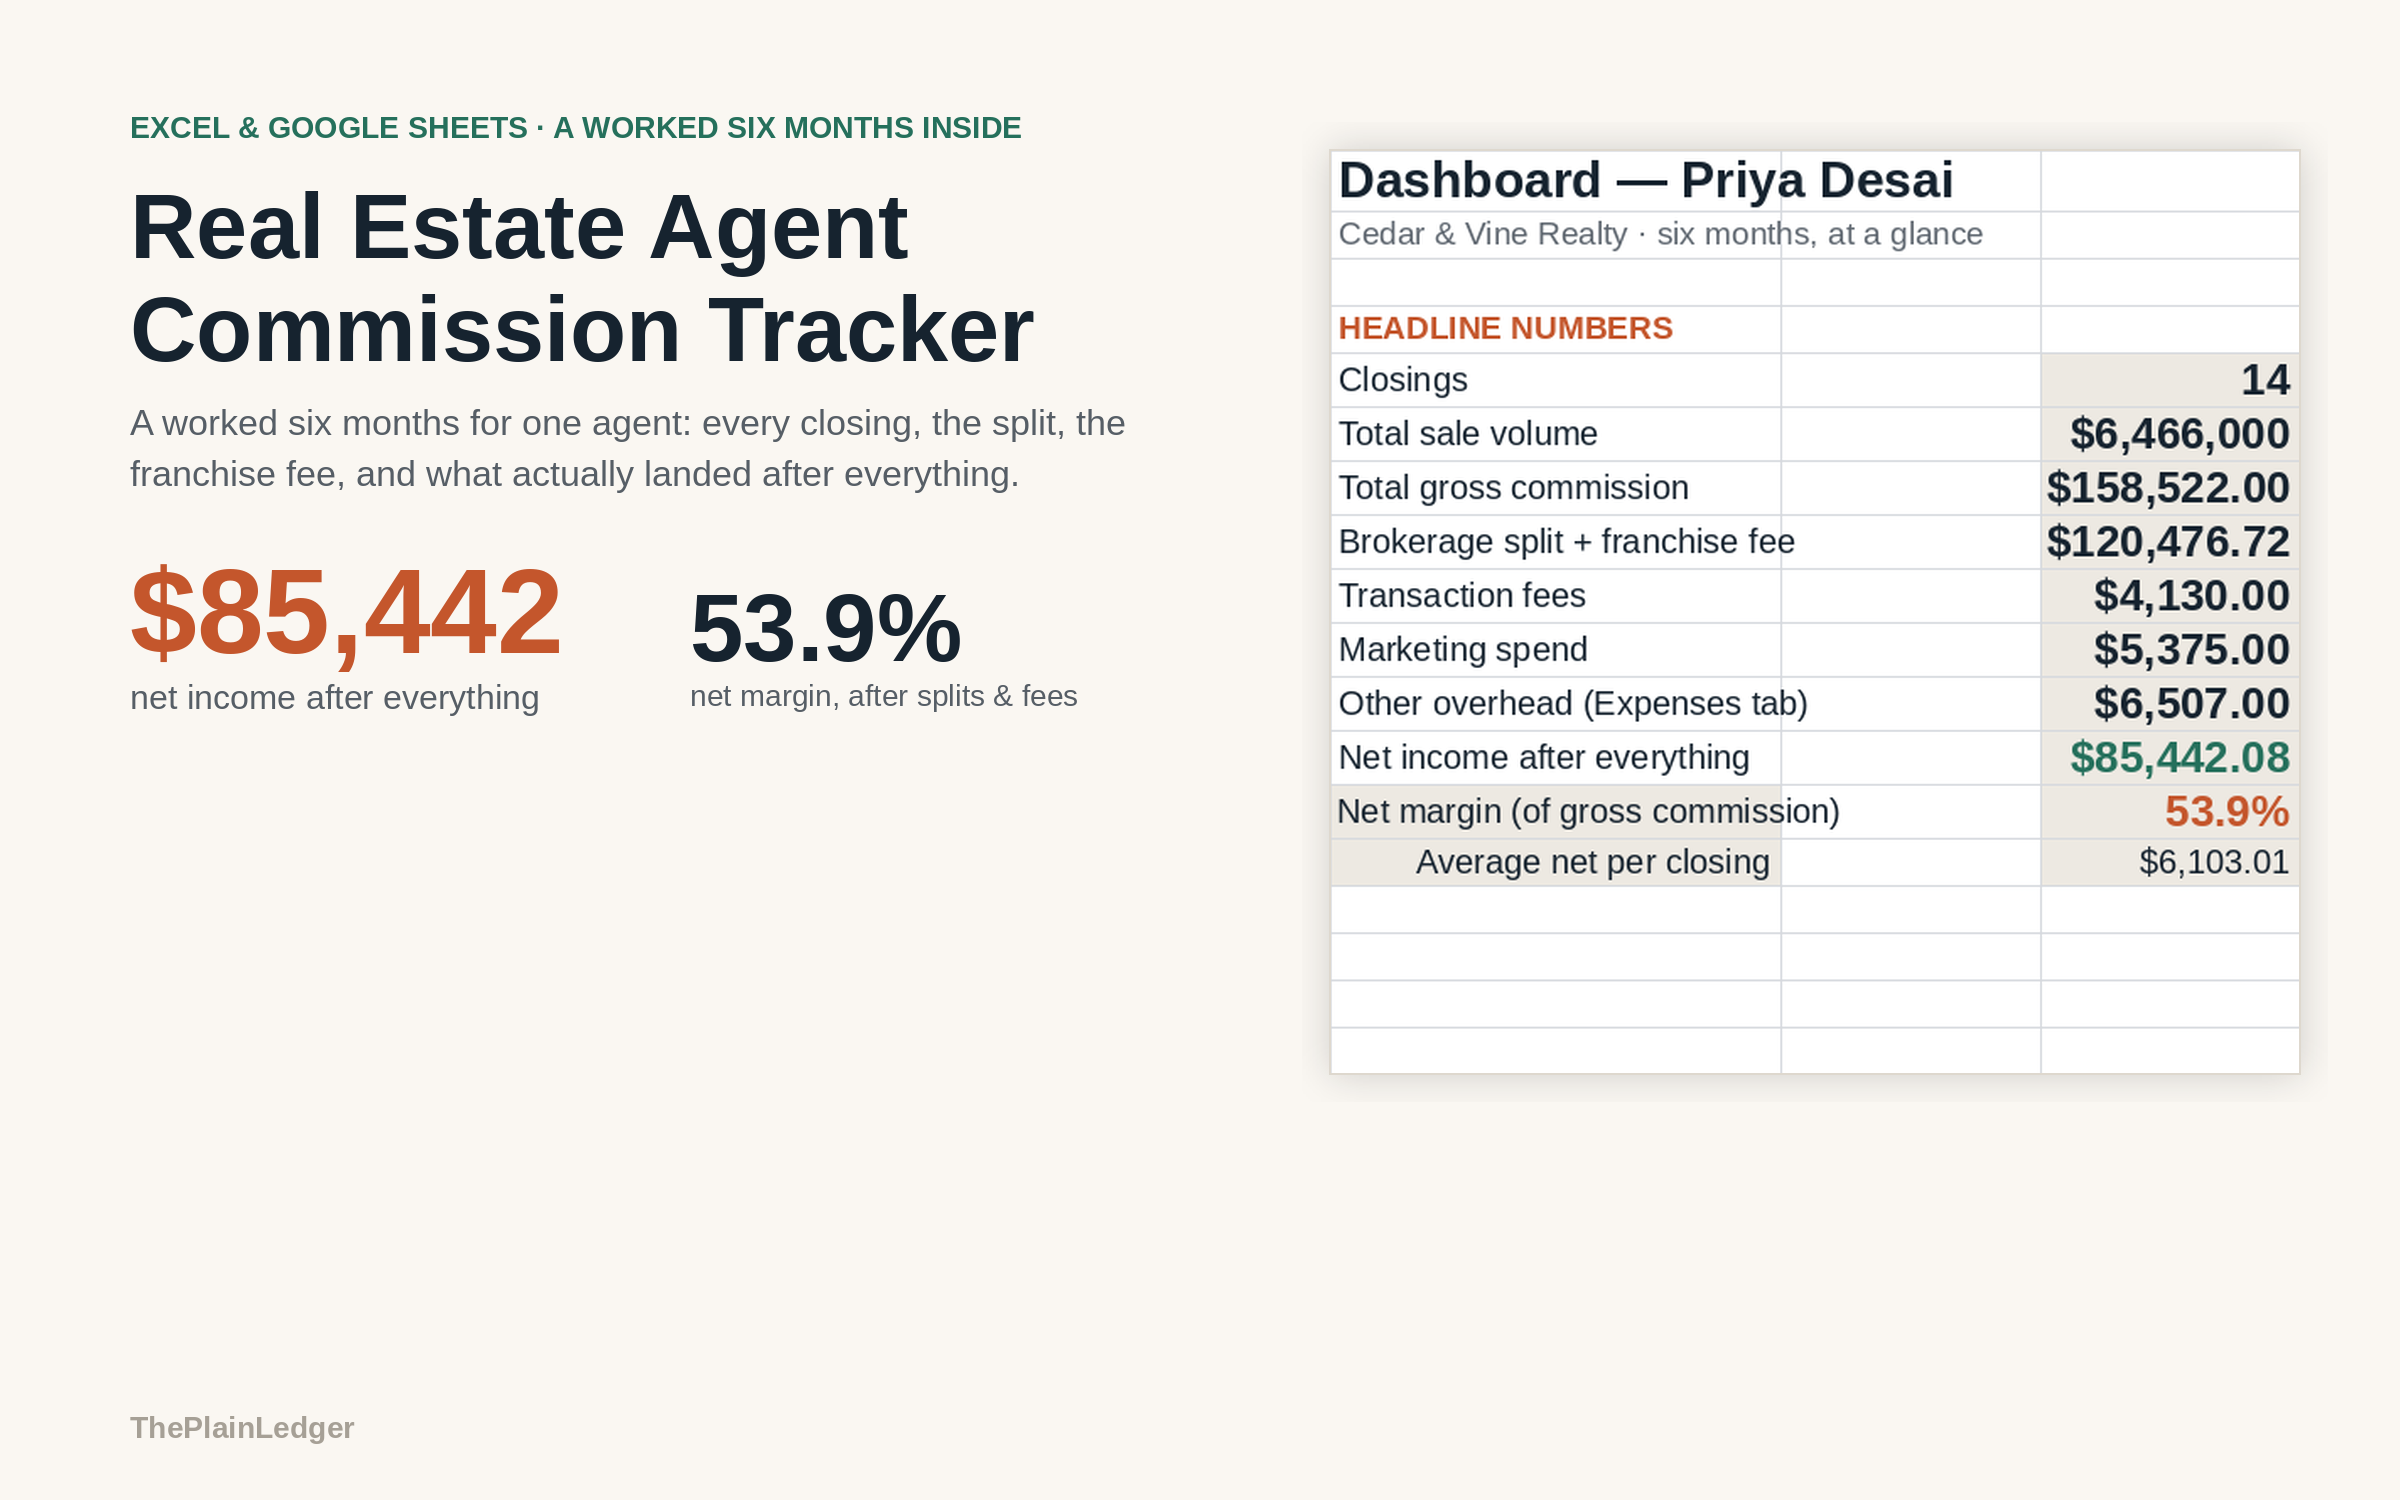
- Dashboard — closings, sale volume, gross commission, what the brokerage and franchise fee took, transaction fees, marketing, overhead and net income, plus month by month and every closing ranked by net commission.
Who it is for
Agents on a percentage split with a franchise fee and a per-deal transaction fee on top, who want six months of closings and six months of overhead in the same file. It assumes that standard split-plus-flat-fee structure; a tiered or capped plan needs the formulas adjusted.
The worked example
The example inside is six months for one agent: 14 closings, with 6 active listings still sitting in the pipeline. Gross commission across those fourteen deals comes to $158,522 — the figure an agent would quote at a team meeting.
After the brokerage split, the franchise fee, a transaction fee on every deal, the marketing spent on each listing and six months of overhead, $85,442 is what the agent actually kept: a 53.9% net margin on gross commission. Line the same fourteen deals up by net commission instead of by sale price and the order changes, because sale price on its own turns out to be a poor guide to which closing paid best.
How it works
Compatible with Microsoft Excel 2016 or newer on Windows or Mac, Google Sheets, and LibreOffice. No macros, no add-ons, no account to create, nothing to install.
The download has two workbooks: one with the example above already filled in, so you can see what every column expects, and the same file completely blank for your own figures. A plain-English guide comes as a PDF. Order on WhatsApp — $9
Orders are taken on WhatsApp: message me and I’ll send the payment details, then the files as soon as the payment is confirmed.
A look inside the file
Questions people actually ask
How do I work out what I actually keep after my brokerage split?
You enter the sale price and commission rate for each closing, and the sheet applies your split, the franchise fee, the flat transaction fee and that deal's marketing cost to give a net commission per closing. The Dashboard then takes six months of overhead off the total. In the worked example, $158,522 of gross commission leaves $85,442 net.
Does it work with a capped or tiered commission plan?
Not as it stands — it is built for one split percentage plus a franchise fee and a flat transaction fee per closing, all set once on the Setup tab. A tiered or capped plan, where your split changes after you hit a production threshold, needs a small change to the formulas. Everything else in the file works exactly the same way.
I have never tracked my expenses. Can I still use it?
Yes — start with the closings alone and add expenses as you go; the Dashboard simply shows less overhead until you fill them in. The filled-in workbook lists the categories most agents actually have, from MLS dues and E&O insurance to desk fees, photography, mileage and CRM software, so you have a checklist rather than a blank page.
Will it work in Google Sheets or do I need Excel?
Yes — it is built as .xlsx and imports into Google Sheets through File, then Import, then Upload, and all 181 formulas carry over. It also opens in Excel 2016 or newer on Windows and Mac, and in LibreOffice. There are no macros and no add-ons to enable.
Does it connect to my MLS or my brokerage's system?
No — it never connects to an MLS, a brokerage back office or a bank, and it never asks for a login. You type the closings and expenses in yourself. It is also not a closing statement: it tracks what you were paid and what it cost you, not what a buyer and seller owe each other at the table.
Need it built around your business?
This file assumes a percentage split with a franchise fee and a flat transaction fee per closing. If your plan is tiered or capped, if you split with a team lead before the brokerage sees it, or if you run a referral fee out of certain deals, I can rebuild the same arithmetic around your actual comp plan.
All other templates are listed on the Excel & Google Sheets Templates page.