
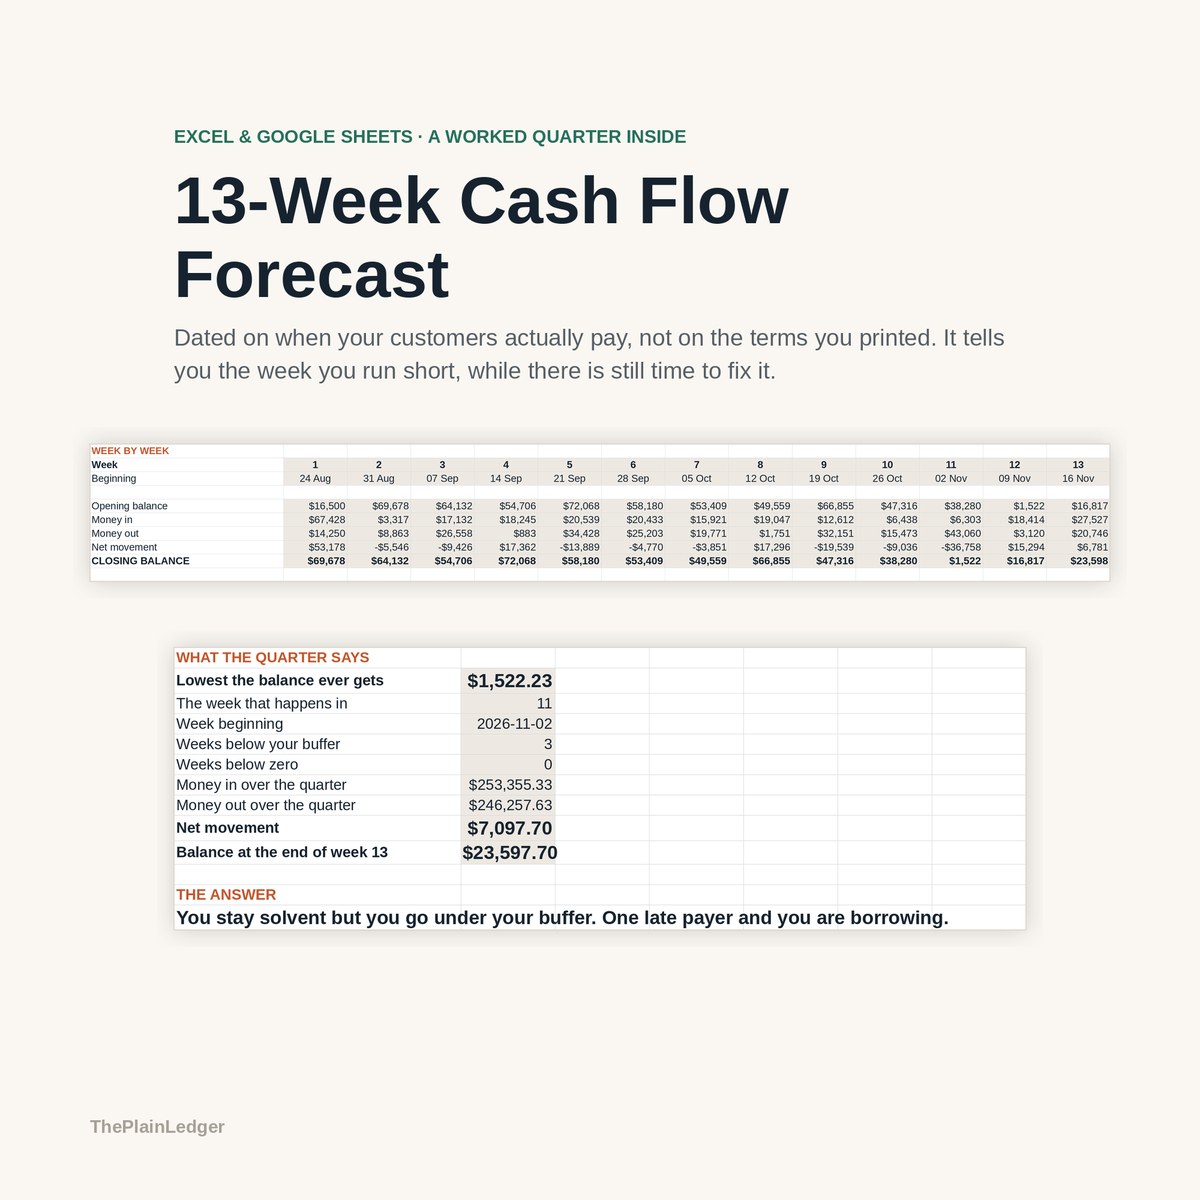
13-Week Cash Flow Forecast Spreadsheet
This 13-week cash flow forecast dates every payment on when your customers actually pay rather than on the terms you printed, and tells you the week you run short while there is still time to do something about it.
Profit and cash are not the same thing. A quarter can look fine on the profit and loss and still leave you unable to pay wages in week eleven. Most cash flow templates assume an invoice on 30-day terms is paid on day 30; yours are not, and that one habit is what this file keeps a record of.
What is in it
- Nine tabs, 1,001 formulas and three charts, from Start Here through to the Dashboard.
- Setup — the Monday week one begins, what is in the bank today, the buffer you never want to go under, and your payroll and tax dates.
- Customers — the terms you give against the days each customer really takes, and the gap between the two. Money In then dates every invoice on the day the cash is actually likely to land.
- Money Out — suppliers, wages, rent, VAT and corporation tax, each on the day it leaves, with the one column that saves you: can this payment move?
- Forecast — thirteen weeks of opening, in, out and closing, red below zero and amber below your buffer. Scenarios re-runs the whole quarter on three levers: a one-off cost, everyone paying later, and sales you never collect.
- Chase List — the fifteen invoices worth a phone call, ranked by what they do to your bank rather than by age, each line showing what the low point becomes if that customer pays. The Dashboard is four numbers, three charts and one sentence.
Who it is for
Owner-managed firms with a payroll to meet and customers who pay when they feel like it. It forecasts thirteen weeks rather than a year, which is the point of it, and it is a cash forecast rather than a profit and loss.
The worked example
The example inside is a nine-person joinery firm across thirteen weeks: 61 invoices in and 81 payments out. It collects $253,355, pays out $246,258, and finishes the quarter with $23,598 in the bank — a quarter that looks perfectly healthy.
It is not. The lowest point in those thirteen weeks is $1,522, in week eleven, and that is with every customer paying the way they usually do. Push every customer payment back by one week and change nothing else, and the same quarter finishes $4,780 overdrawn. That single habit — 30-day terms, paid in 47 — is the difference between a comfortable quarter and going under the buffer for three weeks.
How it works
Compatible with Microsoft Excel 2016 or newer on Windows or Mac, Google Sheets, and LibreOffice. No macros, no add-ons, no account to create, nothing to install.
The download has two workbooks: one with the example above already filled in, so you can see what every column expects, and the same file completely blank for your own figures. A plain-English guide comes as a PDF. Order on WhatsApp — $9
Orders are taken on WhatsApp: message me and I’ll send the payment details, then the files as soon as the payment is confirmed.
A look inside the file
Questions people actually ask
How do I work out which week I run out of cash?
You put in your opening bank balance, your invoices and your outgoings, and the Forecast tab runs thirteen weeks of opening balance, money in, money out and closing balance, colouring anything below zero red and anything below your buffer amber. The low point is the week to act on. In the worked example the quarter ends with $23,598 in the bank but bottoms out at $1,522 in week eleven.
Who is this actually for?
Owner-managed firms with a payroll to meet and customers who pay late — the worked example is a nine-person joinery firm. It is a cash forecast rather than a profit and loss, and it covers thirteen weeks rather than a year, which is deliberate: a quarter is the horizon where you can still change the outcome.
I don't know how long my customers take to pay. Can I still use it?
Look at ten paid invoices and count the days between the invoice date and the payment date before you start — the forecast is only as honest as that one number. The Customers tab then holds the terms you give against the days each one really takes, and the gap between them. Until you have that, the file will simply date payments on your printed terms.
Will it work in Google Sheets or do I need Excel?
Yes — it is built as .xlsx and imports into Google Sheets through File, then Import, then Upload; the 1,001 formulas, the formats and all three charts carry over. It also opens in Excel 2016 or newer on Windows and Mac, and in LibreOffice. There are no macros.
Does it connect to my bank or my accounting software?
No — it does not connect to a bank feed, Xero, QuickBooks or anything else, and it asks for no login. You type the figures in, which is why nothing about your business leaves your own computer. The example firm is invented; the arithmetic behind it is not.
Need it built around your business?
This file assumes one bank account, invoices with terms, and a thirteen-week horizon. If you run several accounts or currencies, take deposits and stage payments across a job, or need a rolling fifty-two weeks instead of a quarter, I can rebuild the same forecast around the way your money actually moves.
All other templates are listed on the Excel & Google Sheets Templates page.